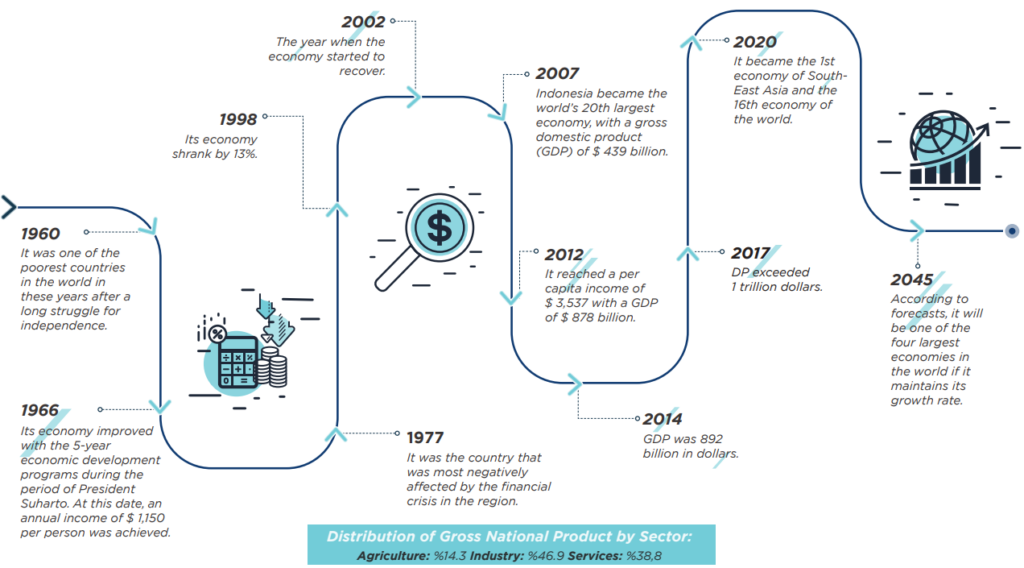
Key Economic Indicators
| 2005 | 2010 | 2015 | 2016 | 2017 | 2018 | 2019 | |
| Development of GDP (Billion $) | 311 | 755 | 861 | 932 | 1015 | 1022 | 1112 |
| Development of GDP Per Capita (Dollars) | 1404 | 3178 | 3368 | 3606 | 3885 | 3871 | 4164 |
| Current Balance (Million Dollars) | 2900 | -3200 | 7900 | 5303 | 16952 | -31051 | -31752 |
| Unemployment Rates (%) | 11,2 | 7,1 | 6,2 | 5,6 | 5,5 | 5,3 | 5,2 |
| Average Consumer Inflation | 10,5 | 5,1 | 6,4 | 3,5 | 3,8 | 3,2 | 3,2 |
| Public Revenues / GDP% | 17,9 | 15,6 | 14,9 | 14,3 | 14,1 | 14,9 | 14,4 |
| Public Expenditures / GDP% | 17,4 | 16,9 | 17,5 | 16,8 | 16,6 | 16,6 | 16,3 |
| Budget balance/GDP (%) | 0,6 | -1,5 | -2,7 | -2,5 | -2,4 | -1,7 | -1,9 |
| Public Debt Stock / GDP% | 42,6 | 24,5 | 27,9 | 28 | 29,4 | 30,1 | 30,3 |


